TimeChart
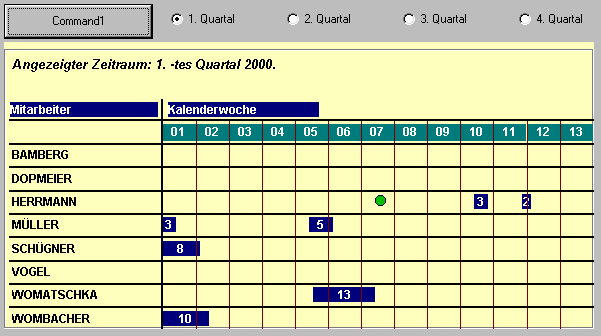
Visualize Time or Date Ranges in a chart ! Noe its very easy to create, for example, Holiday Charts. If you want to display Time or dateranges in a graphic, this is the OCX for you.
Original Author: Axel Womatschka
Inputs
A Access Database (Access 97 or higher, other Access versions may work too, but not tested). A table with Dateinformations (Start- and ending date); setting the Colors and Caption as you wish to design the Layout.
Assumptions
A Demoprojekt with a test Database is included.
Returns
A chart (timeChart).
Side Effects
Because the OCX displays a full year as 52 weeks, the OCX seoerates the year into 4 Quarters. You only have to set the year and a quarter. Everything else the OCX calculates automatically. You only have to set the tablefields of the startind and ending date you wish to display.

About this post
Posted: 2002-06-01
By: ArchiveBot
Viewed: 96 times
Categories
Attachments
CODE_UPLOAD4540452000.zip
Posted: 9/3/2020 3:45:00 PM
Size: 15,945 bytes
Loading Comments ...
Comments
No comments have been added for this post.
You must be logged in to make a comment.