PlotX: Graphics Plotter (y = 2 ^ Sin(x) etc.) (**UPDATE: VERSION: 1.3.0***)
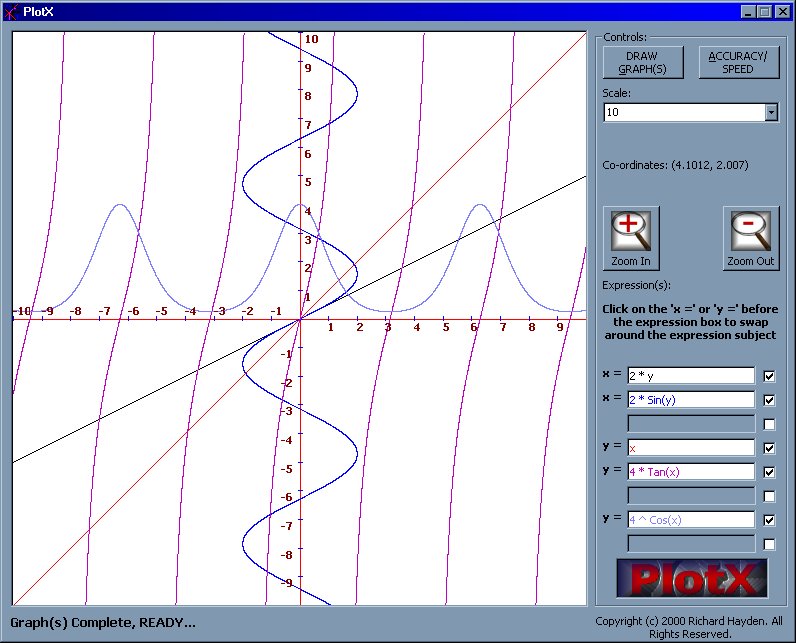
PlotX allows the user to plot up to eight graphs (of the y = ax2 + bx + c type or NOW the x = ay2 + by + c type!) at a time. The user can also use many built in functions like
Sin() and Tan() or Sqr() etc. in their expressions. Expressions are inputted using textboxes and evaluated with the Microsoft Script Control. Colour coding is used and multiple accuracy/speed settings are implemented for ease of use. The scale can also be changed and you can zoom in or out on the graphing area. Version 1.3.0 (THIS ONE) now supports both expressions beginning in 'y =' AND 'x ='! Another addition in version 1.3.0 are two new ULTRA high accuracy settings for very high accuracy graphing.
Original Author: Richard Hayden
API Declarations
See Code.
About this post
Posted: 2002-06-01
By: ArchiveBot
Viewed: 80 times
Categories
Attachments
CODE_UPLOAD1157911112000.zip
Posted: 9/3/2020 3:45:00 PM
Size: 34,426 bytes
Loading Comments ...
Comments
No comments have been added for this post.
You must be logged in to make a comment.