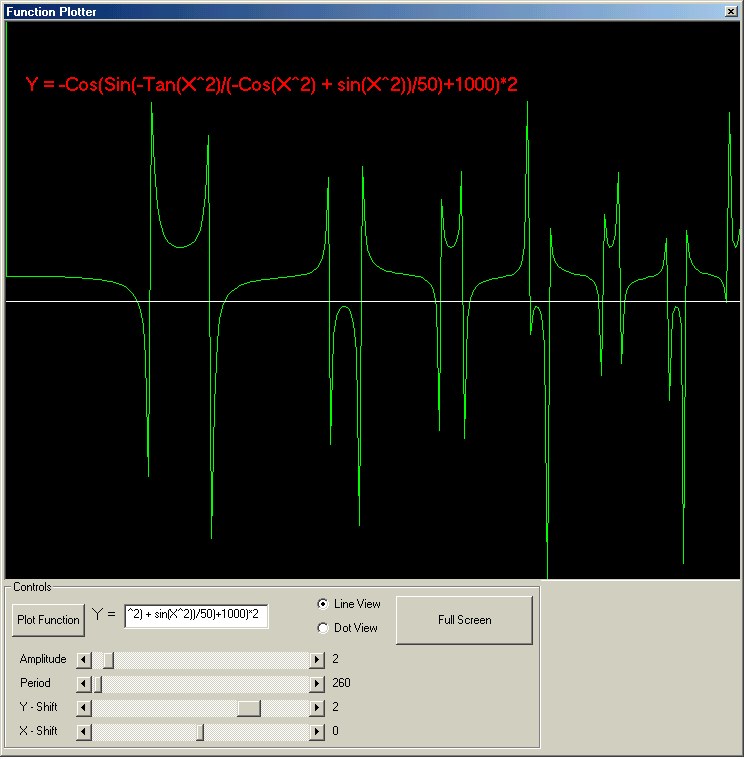
Function Plotter
You ype in a function. It is plotted as a graph. You can manipulate the graph by changing its y-shift, x-shift, period and frequency. You can also interchange between dot and line plotting. It will dynamically update the graph when you change something about it. Please leve some feedback and tell me wha you think. Its not meant to be a huge project, just a one hour hing thatt'll maybe help somebody in the future.
Original Author: Coding Genius
About this post
Posted: 2002-06-01
By: ArchiveBot
Viewed: 88 times
Categories
Attachments
Function_P612483112002.zip
Posted: 9/3/2020 3:45:00 PM
Size: 3,822 bytes
Loading Comments ...
Comments
No comments have been added for this post.
You must be logged in to make a comment.